

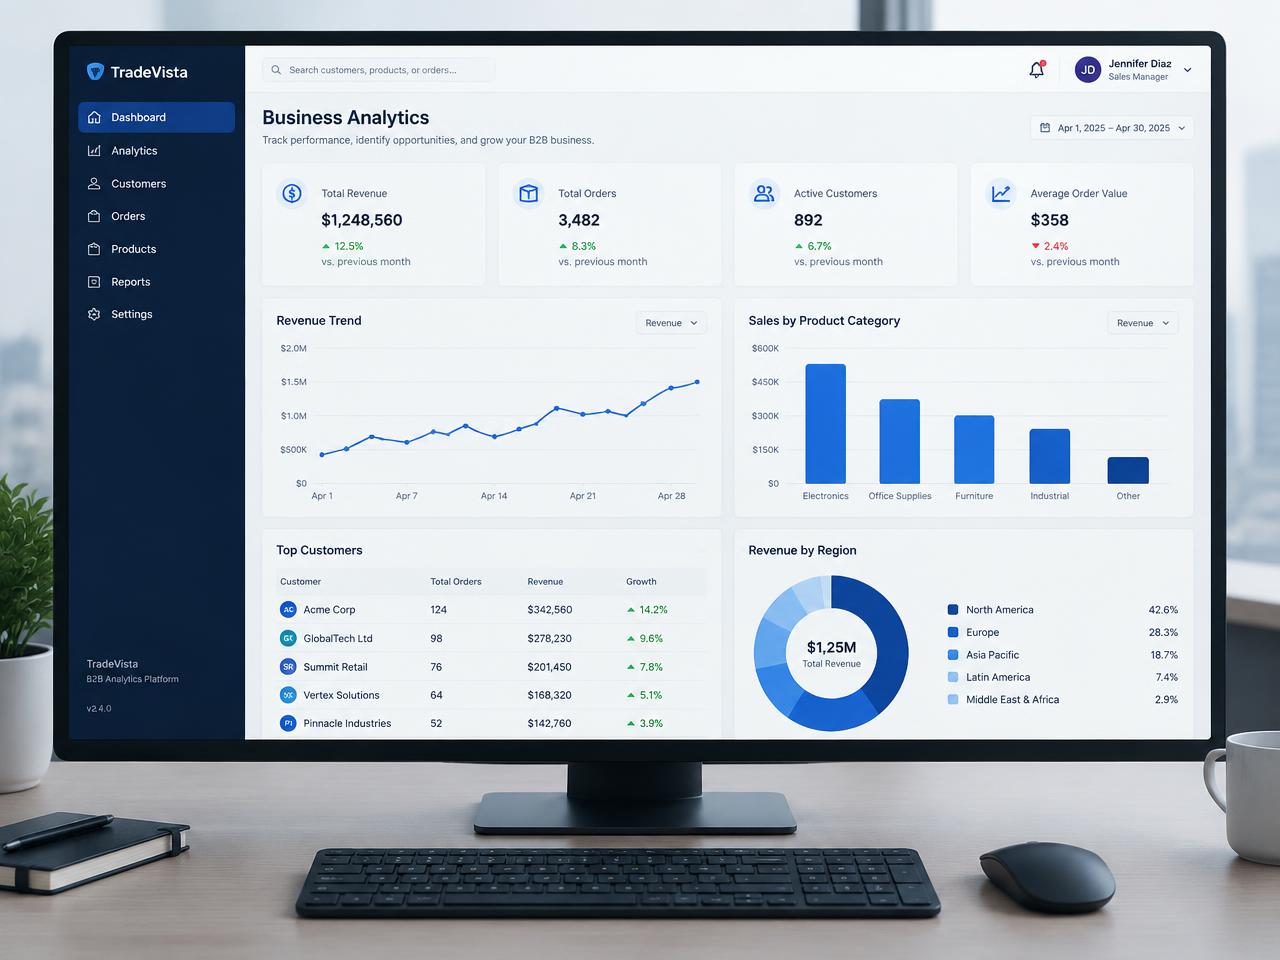
A distribution business had numbers in four systems and no agreed answer to simple questions. We modelled the data, built a reporting workspace with revenue, customer and product views, and automated the nightly pipeline. Monday reporting went from a two-day scramble to a dashboard that is already correct.
4 systems
into one view
Nightly
automated refresh
-2 days
reporting effort
What we did
- Data modelling and metric definitions
- Nightly ingestion and transformation pipeline
- Dashboard interface design and build
- Scheduled reports and alert thresholds
- Hosting, monitoring and ongoing maintenance
Stack
Agreed metrics
Every figure has one definition, documented and applied consistently across views.
Revenue and product views
Trends by region, category and customer, with period comparisons built in.
Automated pipeline
Nightly ingestion, validation and alerting so the numbers are ready before the team is.
Scheduled reports
Weekly summaries land in inboxes without anyone assembling a spreadsheet.
More of our work
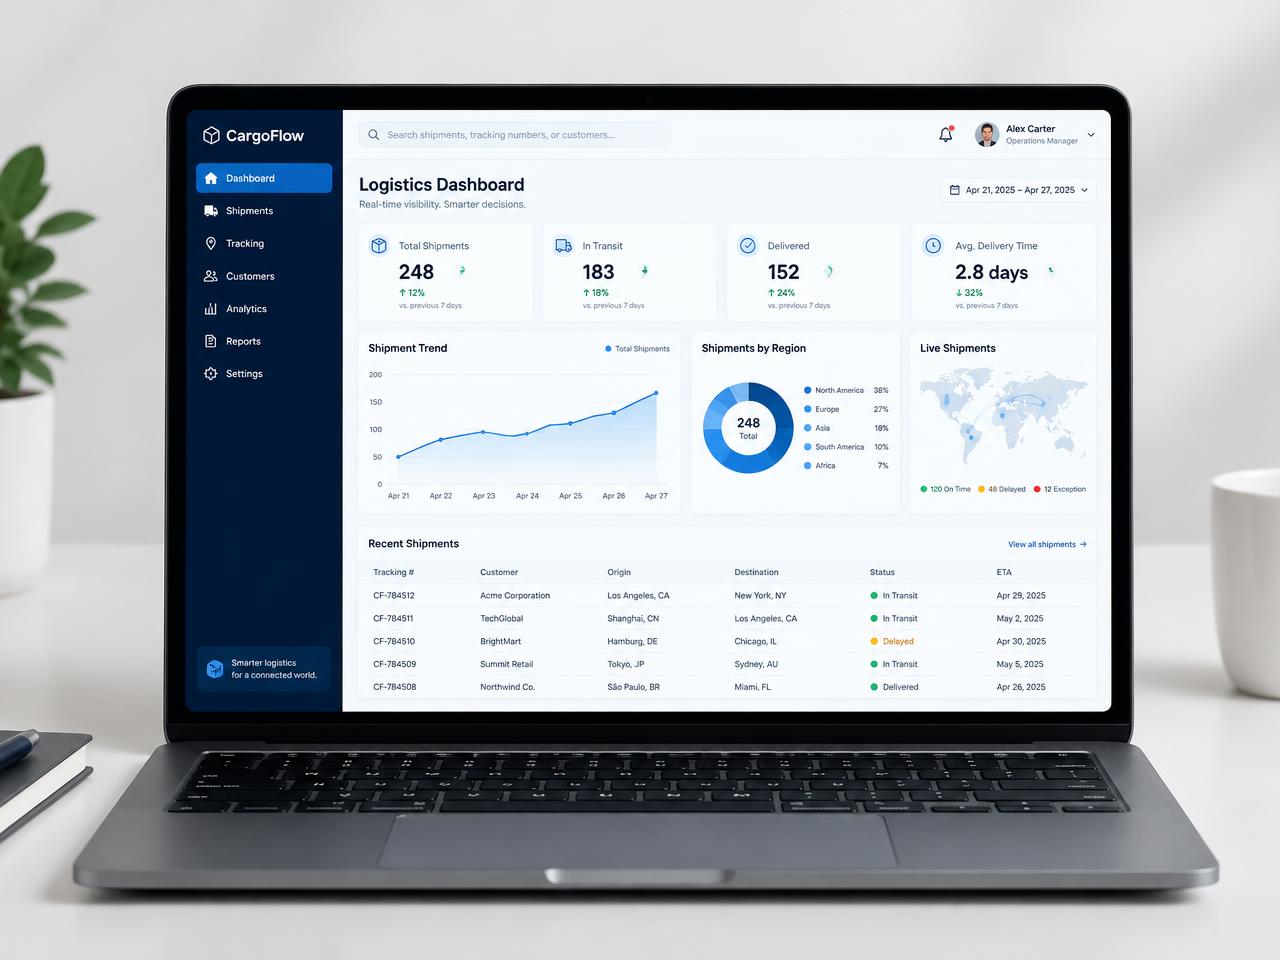
Logistics operations platform
A shipment operations dashboard that replaced spreadsheets for a mid-sized freight team.
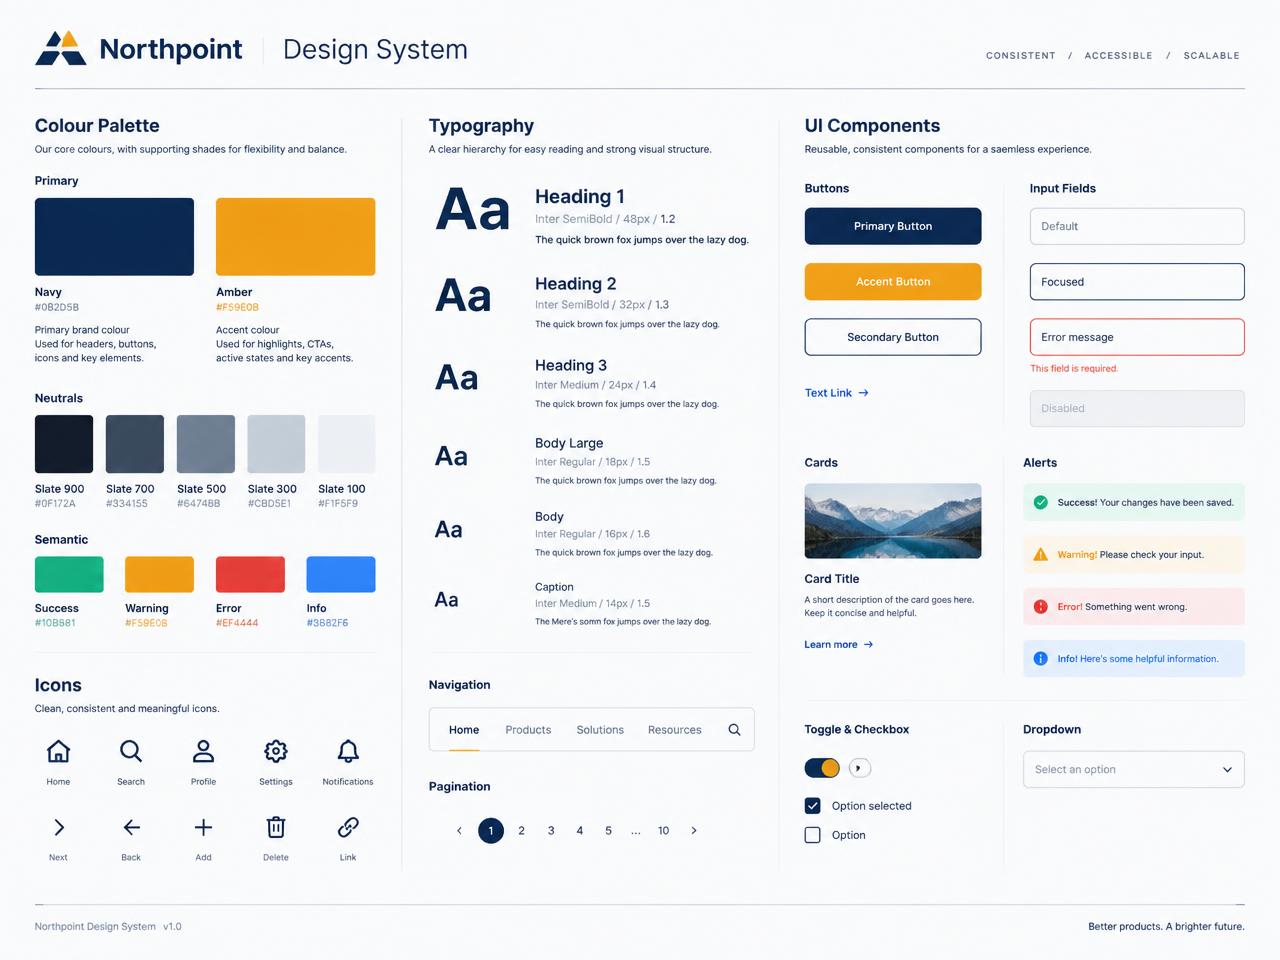
Product design system
A complete design language and component library for a multi-product software team.
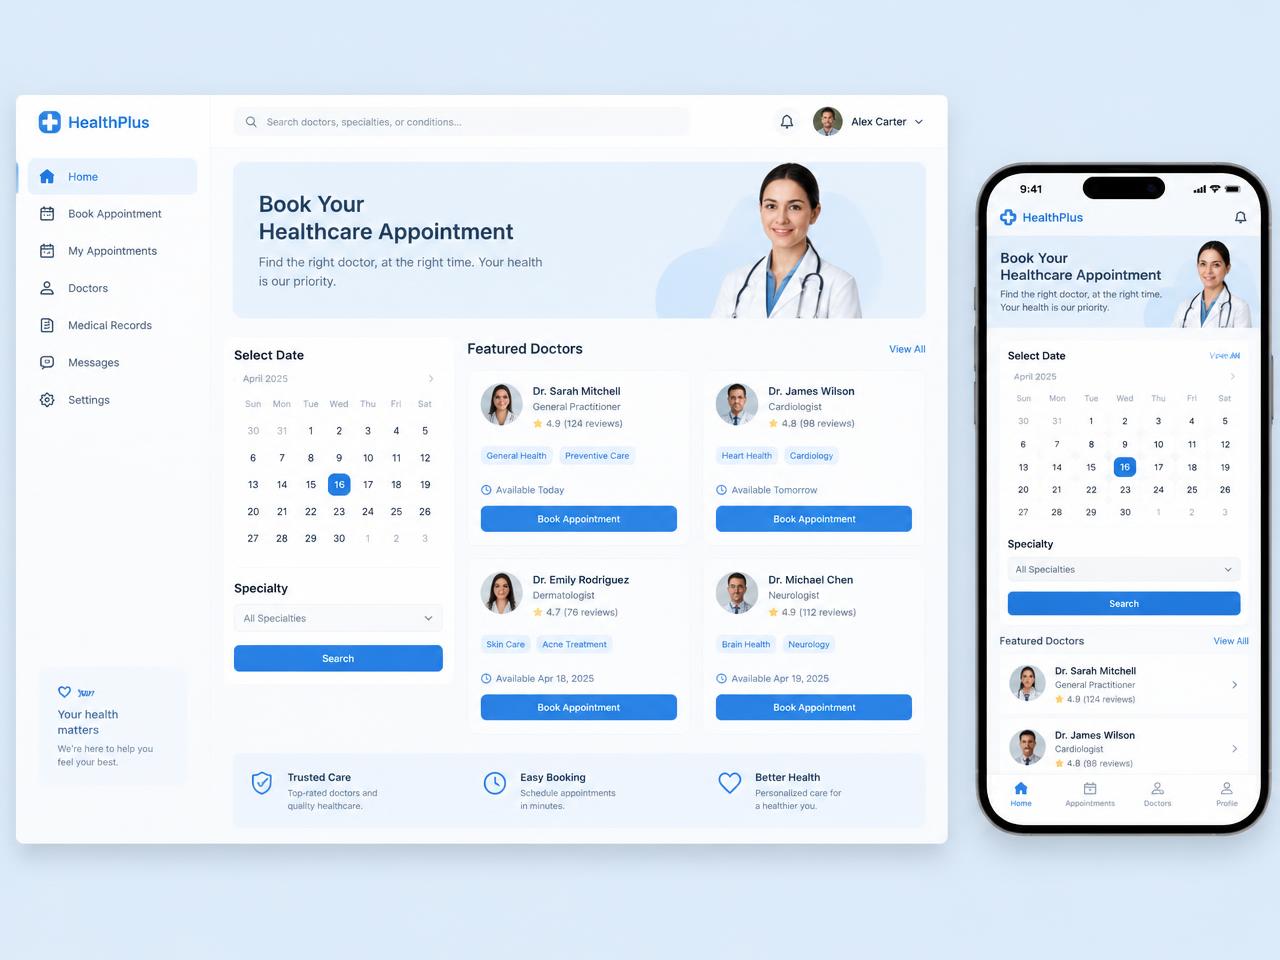
Healthcare booking app
A calm, accessible appointment booking experience for a multi-clinic practice group.
Want something like this?
Tell us what you're building and we'll map the fastest honest route to launch.
Book a consultation